


![[VIP] Unlimited Pass 2026.05.27](https://i.pinimg.com/1200x/d2/f8/2e/d2f82e903b9ca33b0f13704cc85a3d8a.jpg)

![[LS] ls.graphics Pass 2026.02.16](https://i.pinimg.com/1200x/8d/ca/7f/8dca7ff72d8b698f955649340d0ff398.jpg)


![[VIP] Marketly: Website Marketplace](https://i.pinimg.com/1200x/04/b8/08/04b8084a0586740068dca684f9ec896d.jpg)

![[VIP] Solito: Finance Dashboard Dark Theme](https://i.pinimg.com/1200x/bc/e7/51/bce751c5042d26ae6706c925851ee318.jpg)


![[VIP] Claude Code: Practical Guide for Product Designers](https://img1.teletype.in/files/8c/2d/8c2d1b8b-d868-4042-8a6f-393300fefcea.jpeg)

![[VIP] ShadCnKit: UI Kit [Mar 2026]](https://i.pinimg.com/1200x/f6/1b/82/f61b82730374fcaf1f474d520af0153b.jpg)
![[VIP] Vault: Finance Dashboard](https://i.pinimg.com/1200x/50/43/9e/50439e7a9ac97af7fff80b1e227c8045.jpg)
![[VIP] Voltz: Electric Car Website Template](https://i.pinimg.com/1200x/03/ba/41/03ba41513483727fcd26b95349750783.jpg)


![[VIP] App Store Screenshot Templates & Mockups](https://i.pinimg.com/1200x/9d/d3/00/9dd300bdea1902edf4840e2ffdfae381.jpg)


![[VIP] 44 Device Mockups: Metal Scene Pack](https://i.pinimg.com/1200x/96/0c/c4/960cc4d39f6f9f08c4ba4a40ae740a65.jpg)
![[LS] iPhone 17 Mockup](https://i.pinimg.com/1200x/18/42/c1/1842c11e3da971765bdcfbc5315f3df8.jpg)


![[VIP] Thanos Kagkalos: MotionPunk](https://i.pinimg.com/1200x/a3/1a/c3/a31ac3bb681fdb27f0a70db35bf2b1c3.jpg)


![[VIP] Claude for Coaches](https://i.pinimg.com/1200x/ce/7e/e9/ce7ee94d0c45aa335d61d9b4c5250ebb.jpg)
![[VIP] Ultimate Editors v2.0.4](https://i.pinimg.com/1200x/cc/d3/95/ccd3956d1bfb782aef85451d9cfba8e4.jpg)

![[VIP] Awwwards: How to embrace contemporary trends and create award winning experiences](https://i1-c.pinimg.com/1200x/d9/21/cd/d921cd5ada848c5da37d94a06fd1f150.jpg)
![[VIP] Awwwards: Ecommerce Design from Scratch with Figma](https://i.pinimg.com/1200x/72/26/e7/7226e701dc52d3ae44c09b49a3edf508.jpg)
![[VIP] Awwwards: Presenting yourself as a designer](https://i.pinimg.com/1200x/a0/50/57/a0505720b8c4061ec44d3439c7e761ae.jpg)


![[VIP] React Three Fiber: The Ultimate Guide to 3D Web Development](https://i.pinimg.com/1200x/78/02/1f/78021ffdfc8113cc8caba5b2c563ead4.jpg)
![[VIP] Ryan Hayward: Ultimate Framer Masterclass 3.0](https://i.pinimg.com/1200x/48/d6/3f/48d63f9723d7c49e6c34c182557c7431.jpg)


![[VIP] Whoooa! 156 vector Lottie animations](https://design.rip/uploads/cover/blog/whoooa-156-vector-animations.webp)

![[VIP] The LogoLounge Guide to Iconic Branding](https://i1-c.pinimg.com/1200x/96/9a/e8/969ae8a428253ab6ee3c2c17a22c9c89.jpg)
![[VIP] Framer Money Playbook](https://i.pinimg.com/1200x/38/58/ee/3858eecb51c038d10d7a67df213740cd.jpg)


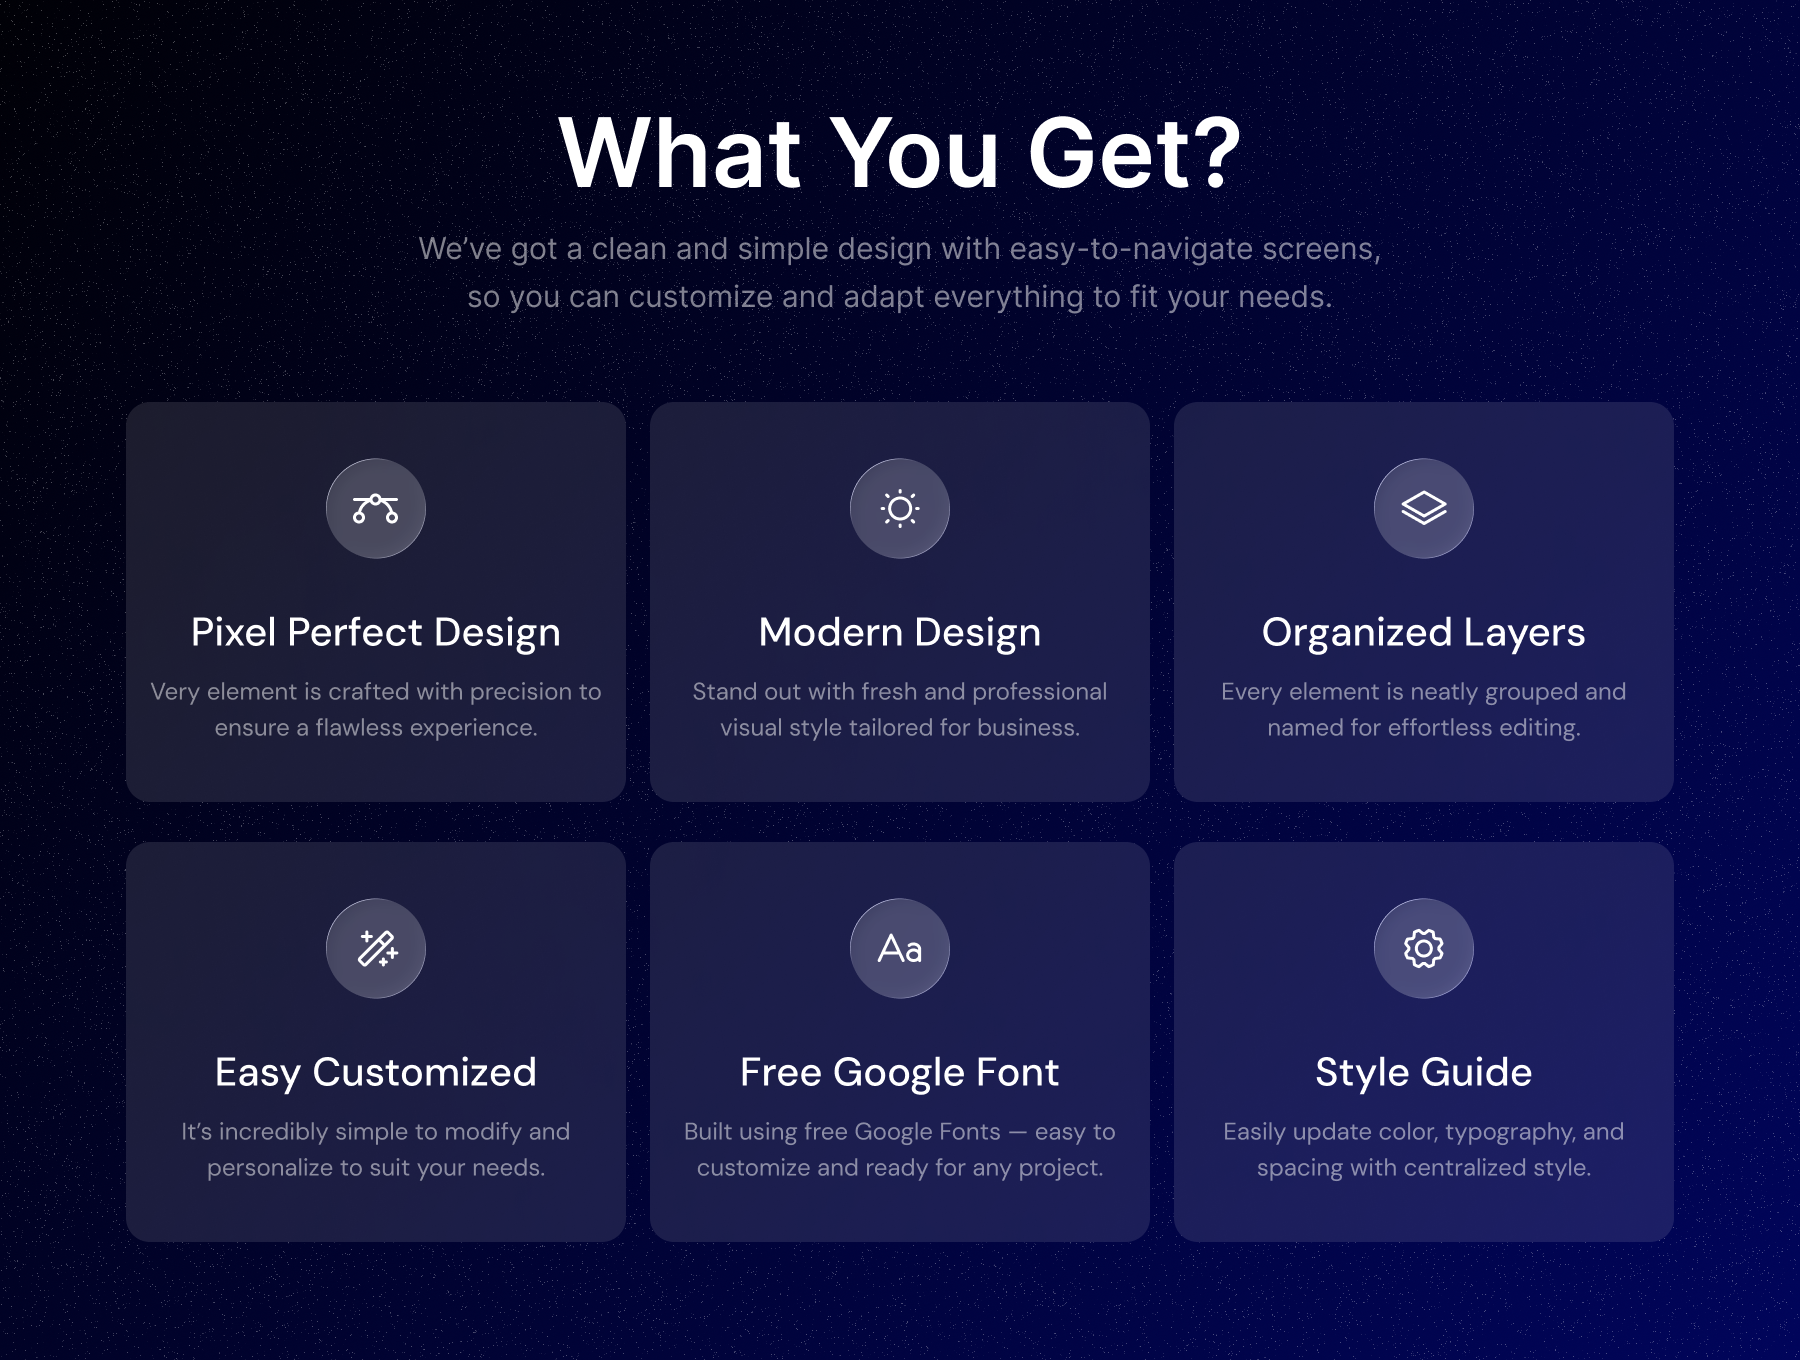
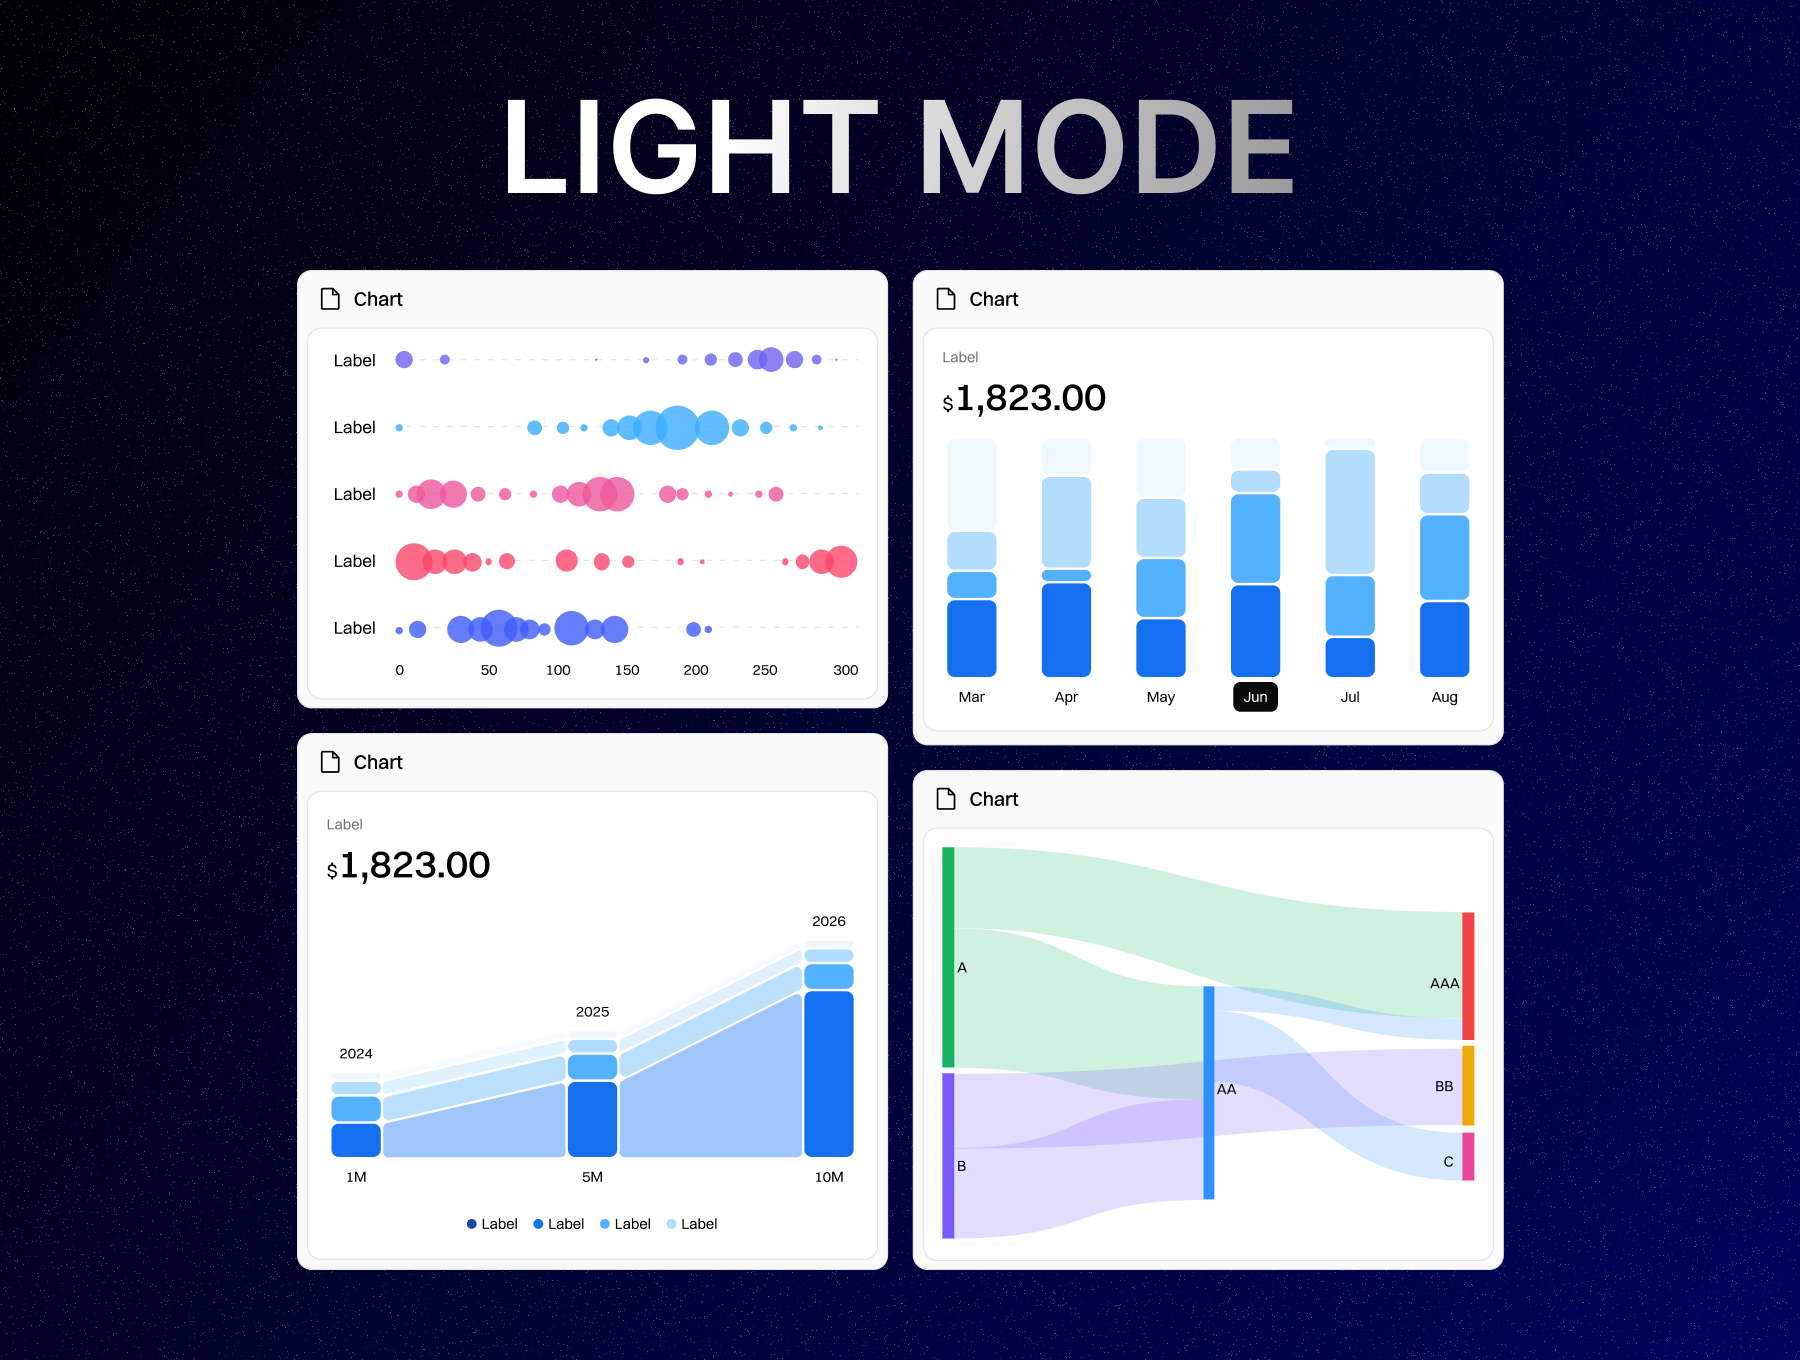
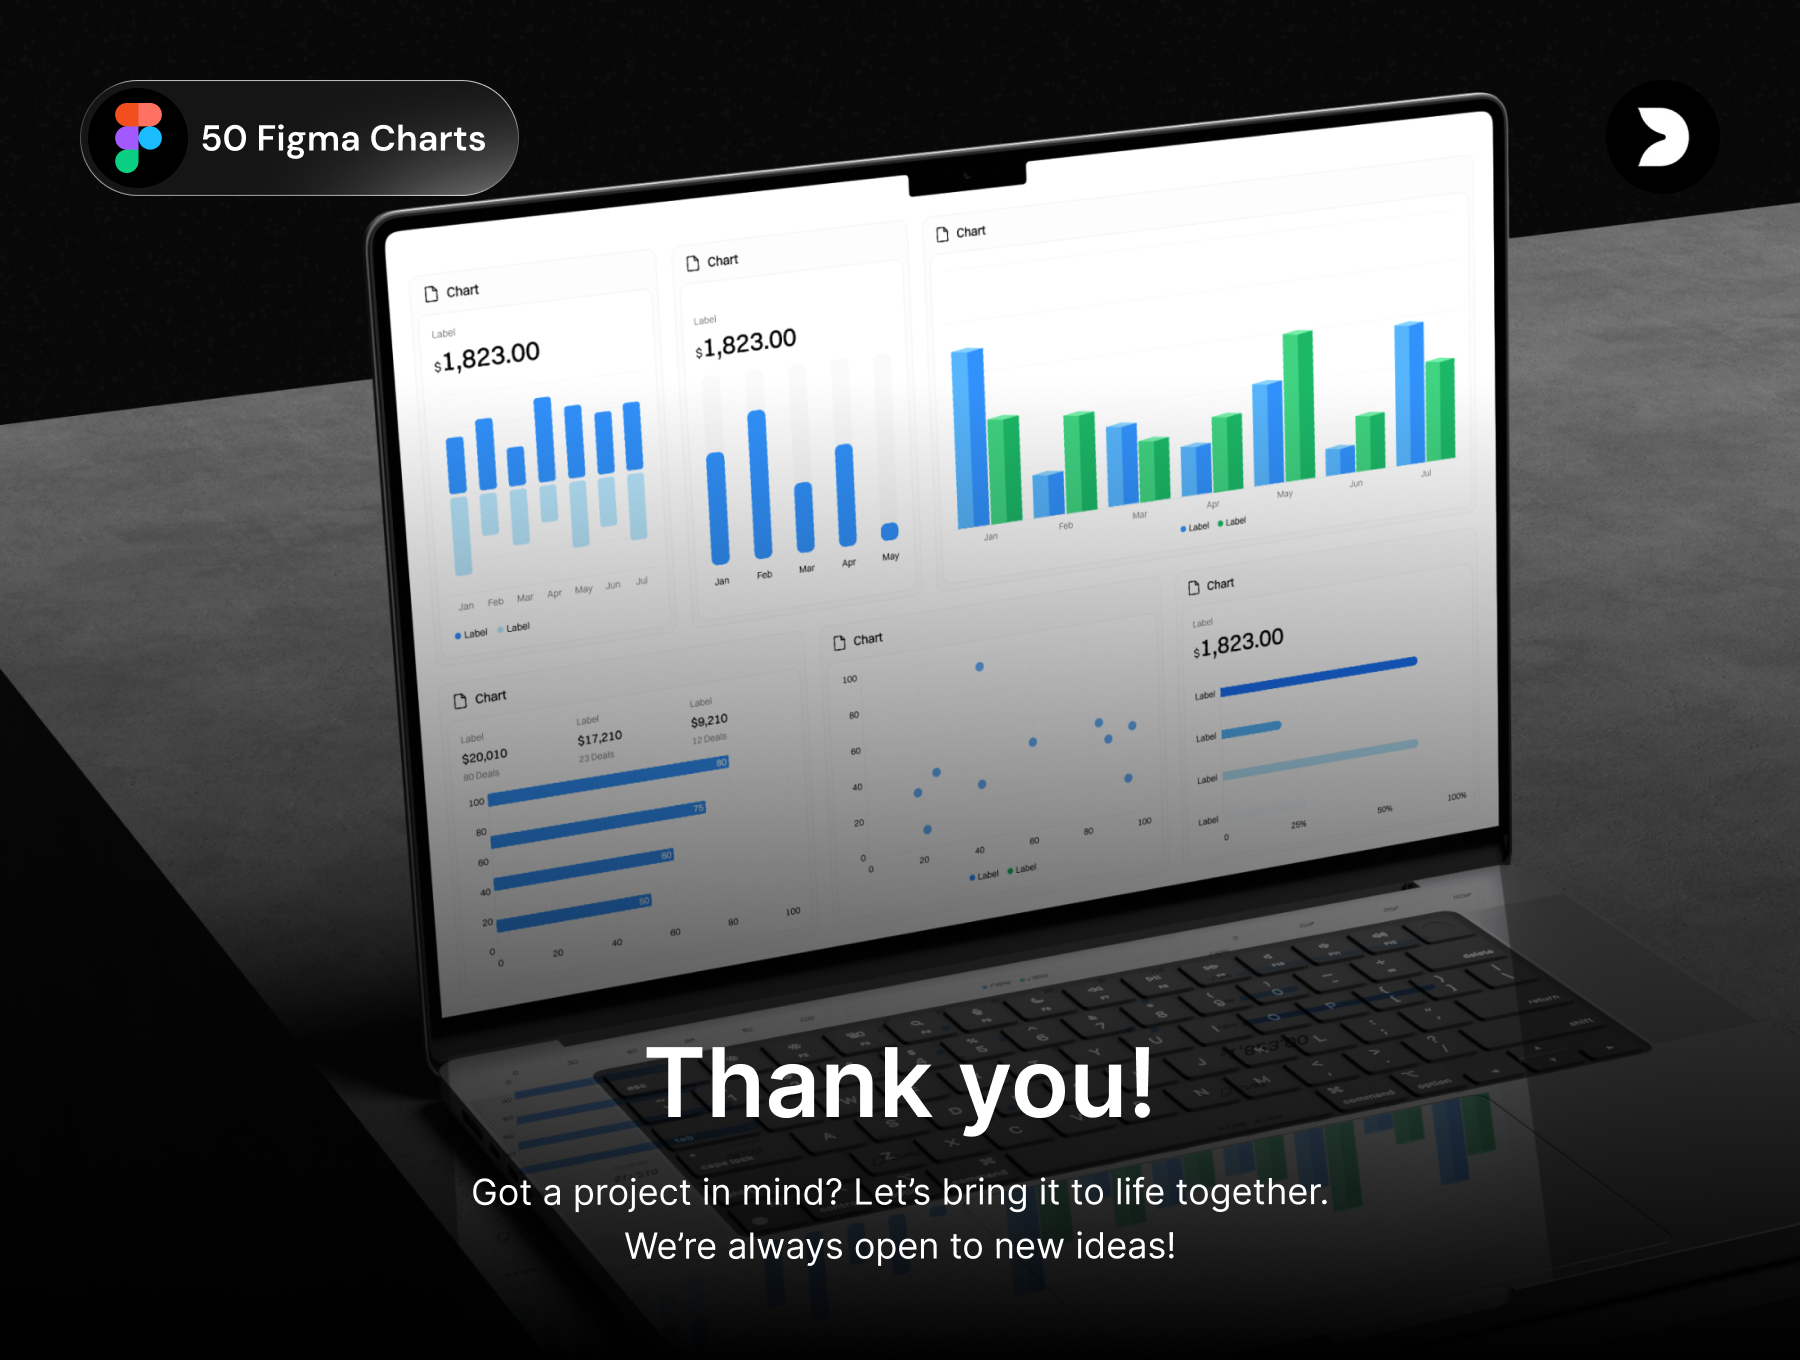
Dashboard Charts UI Kit
Premium and elegant collection of data visualization components designed for modern dashboards, analytics platforms, and SaaS applications.

Overview
Introducing the Charts UI Kit Pack, a premium and elegant collection of data visualization components designed for modern dashboards, analytics platforms, and SaaS applications.
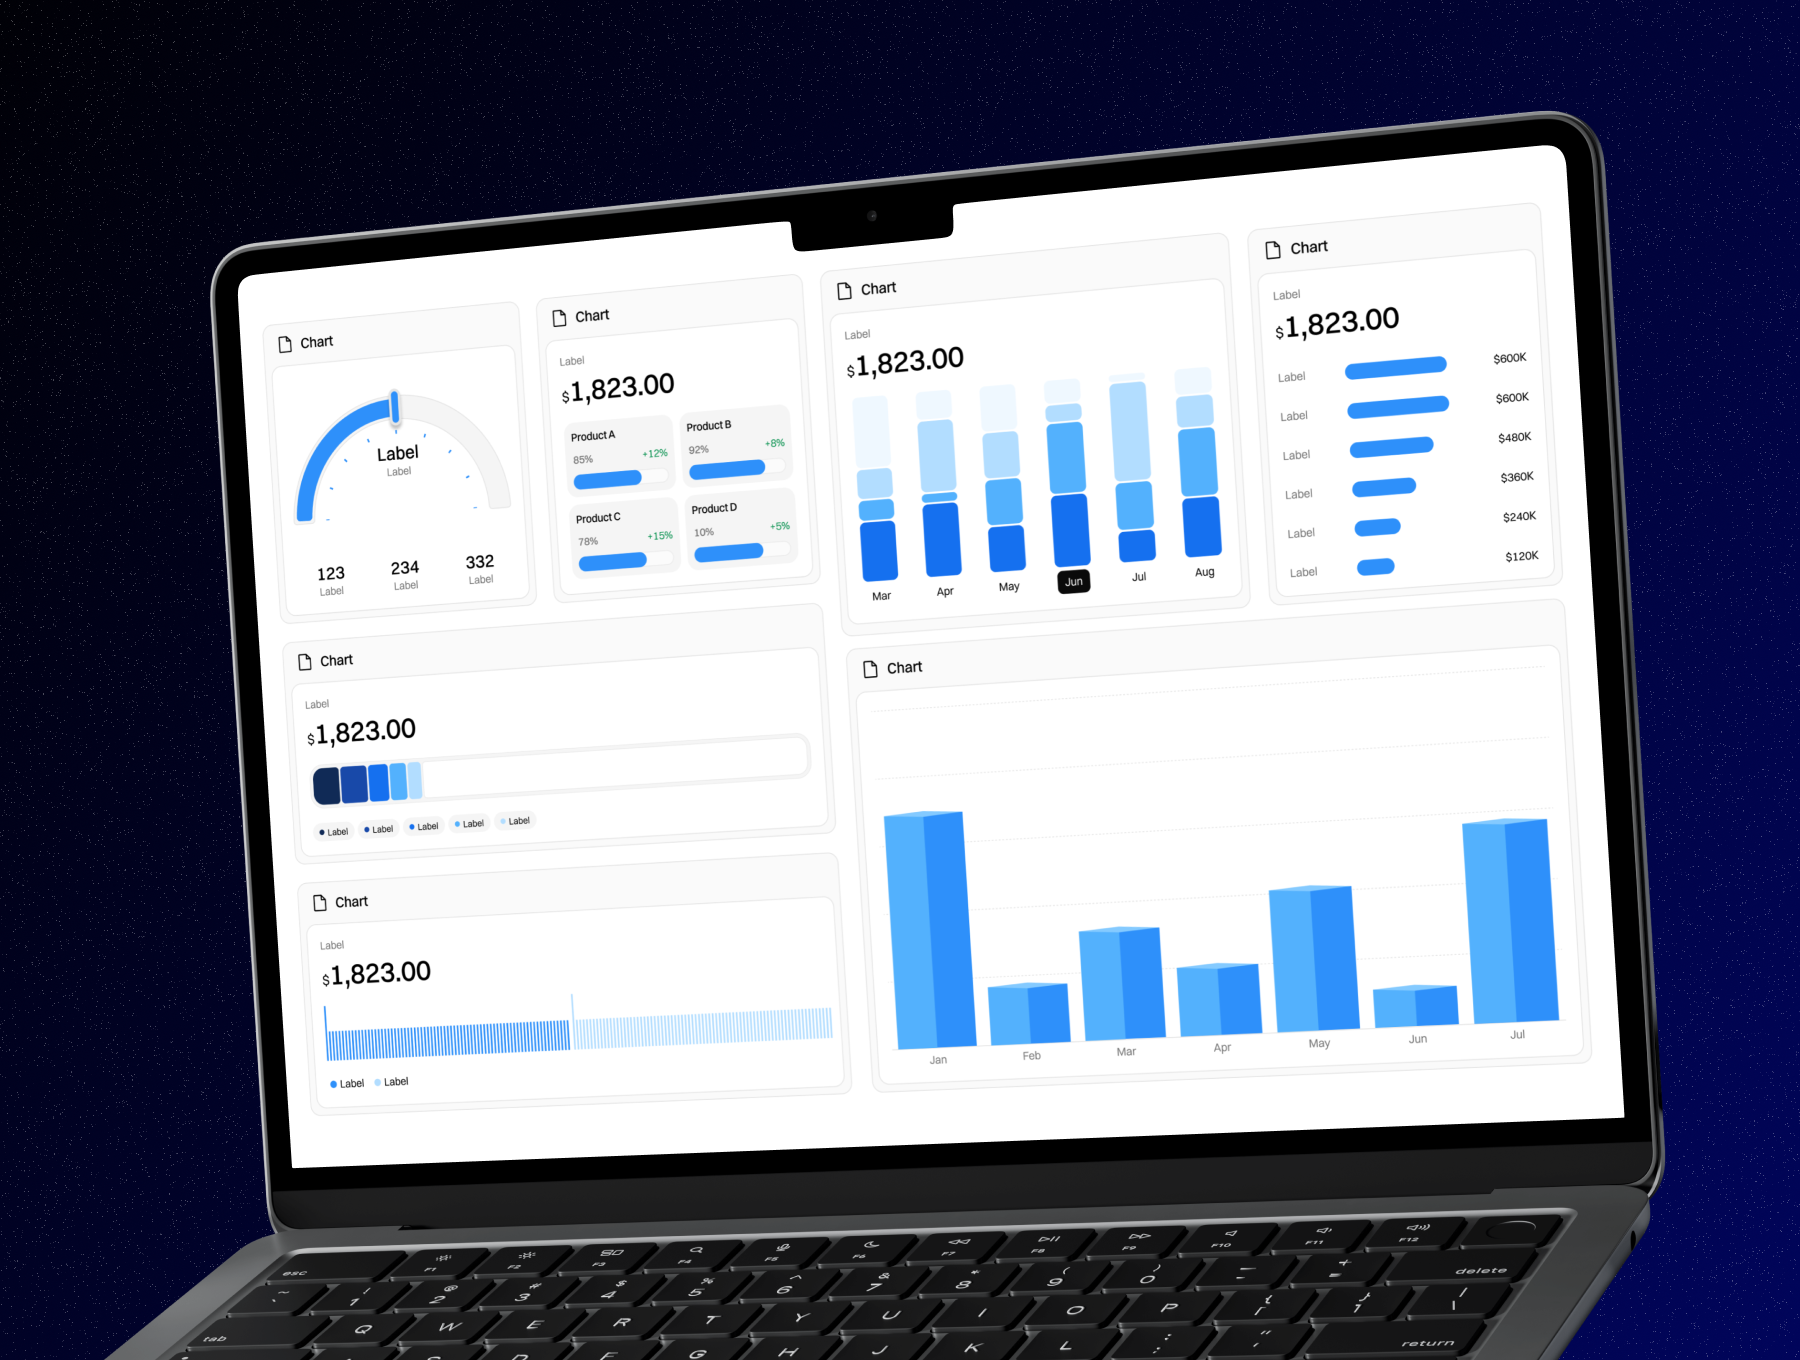
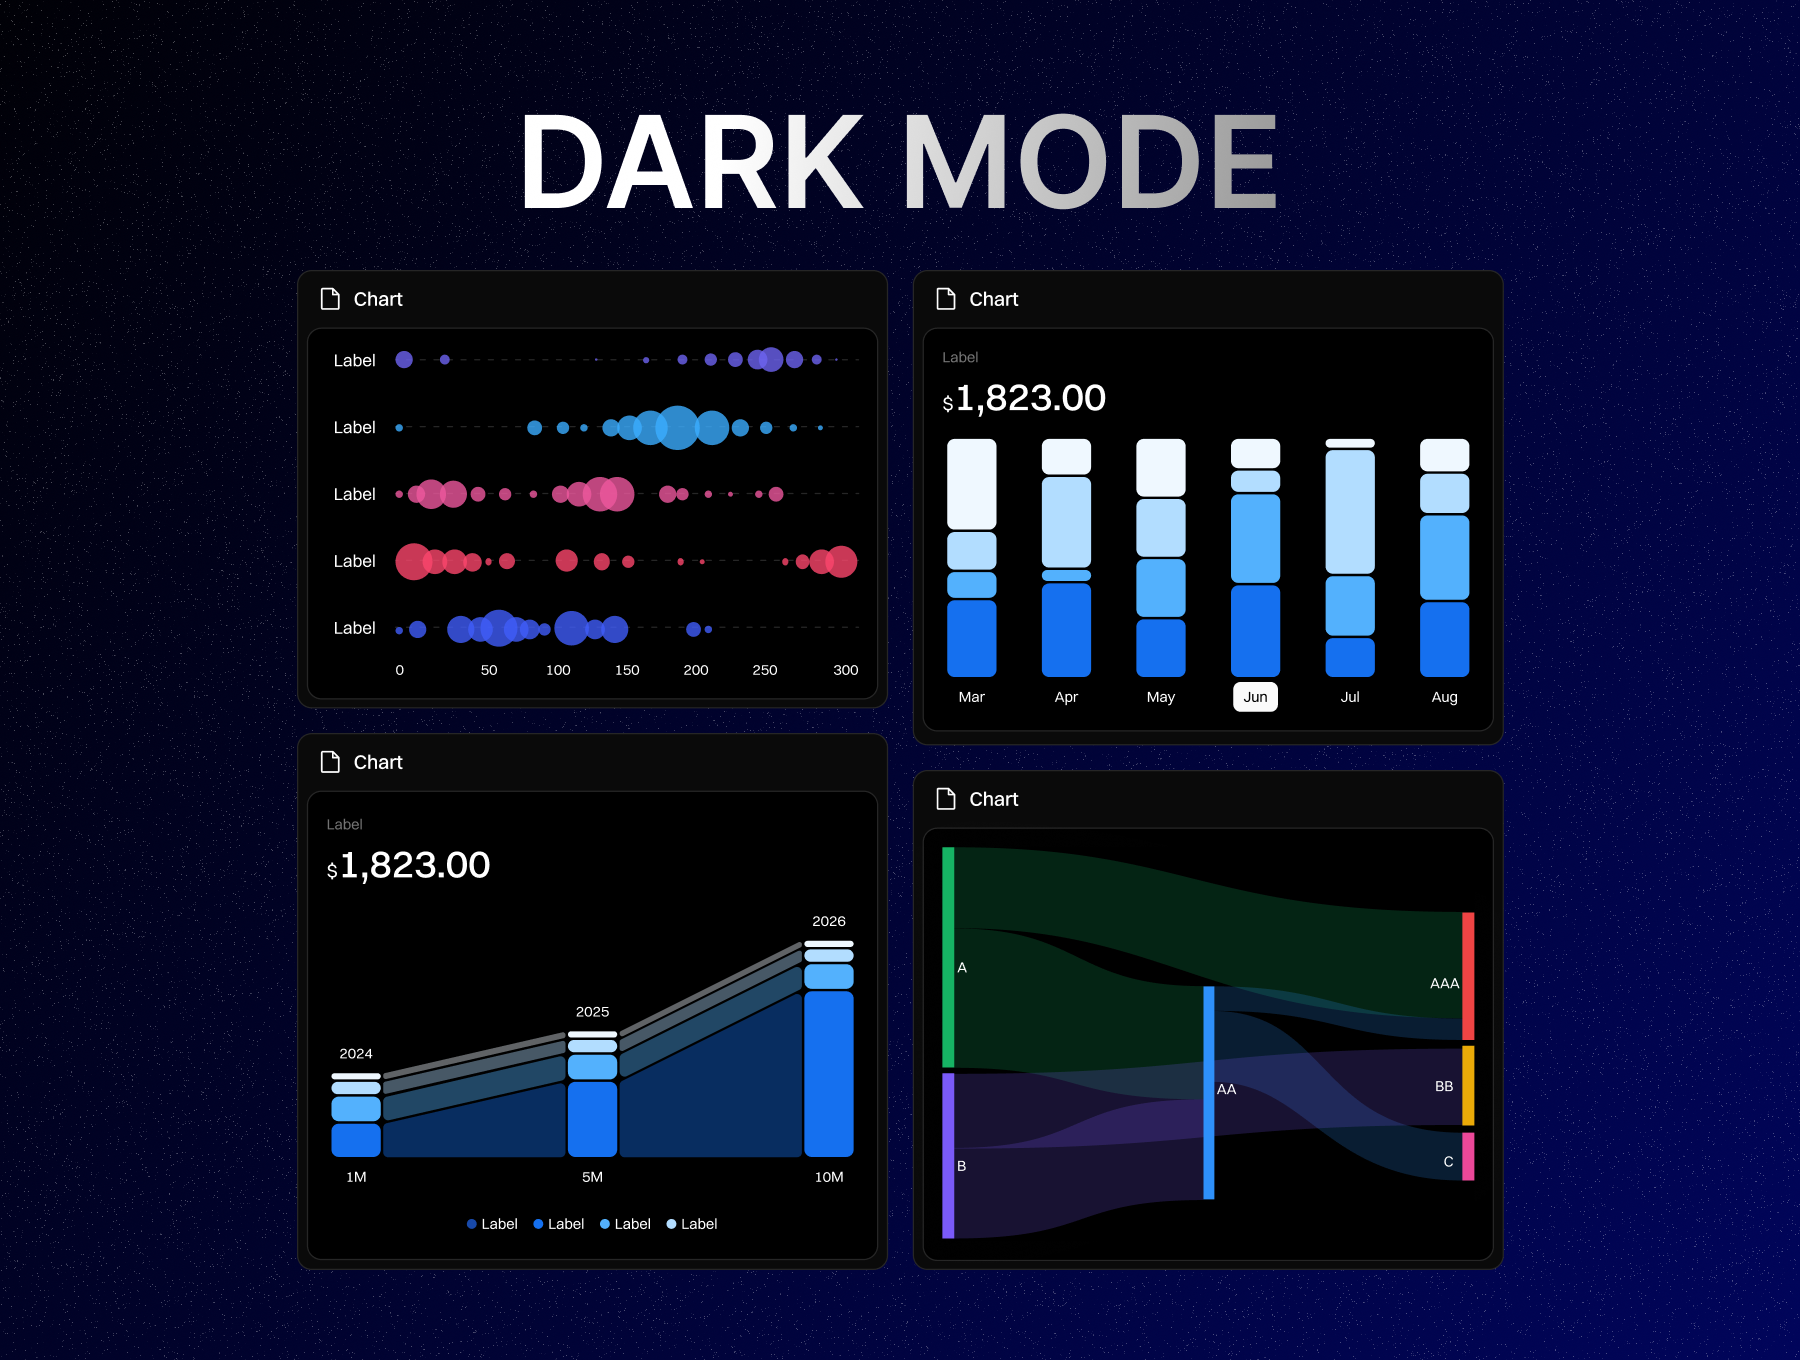
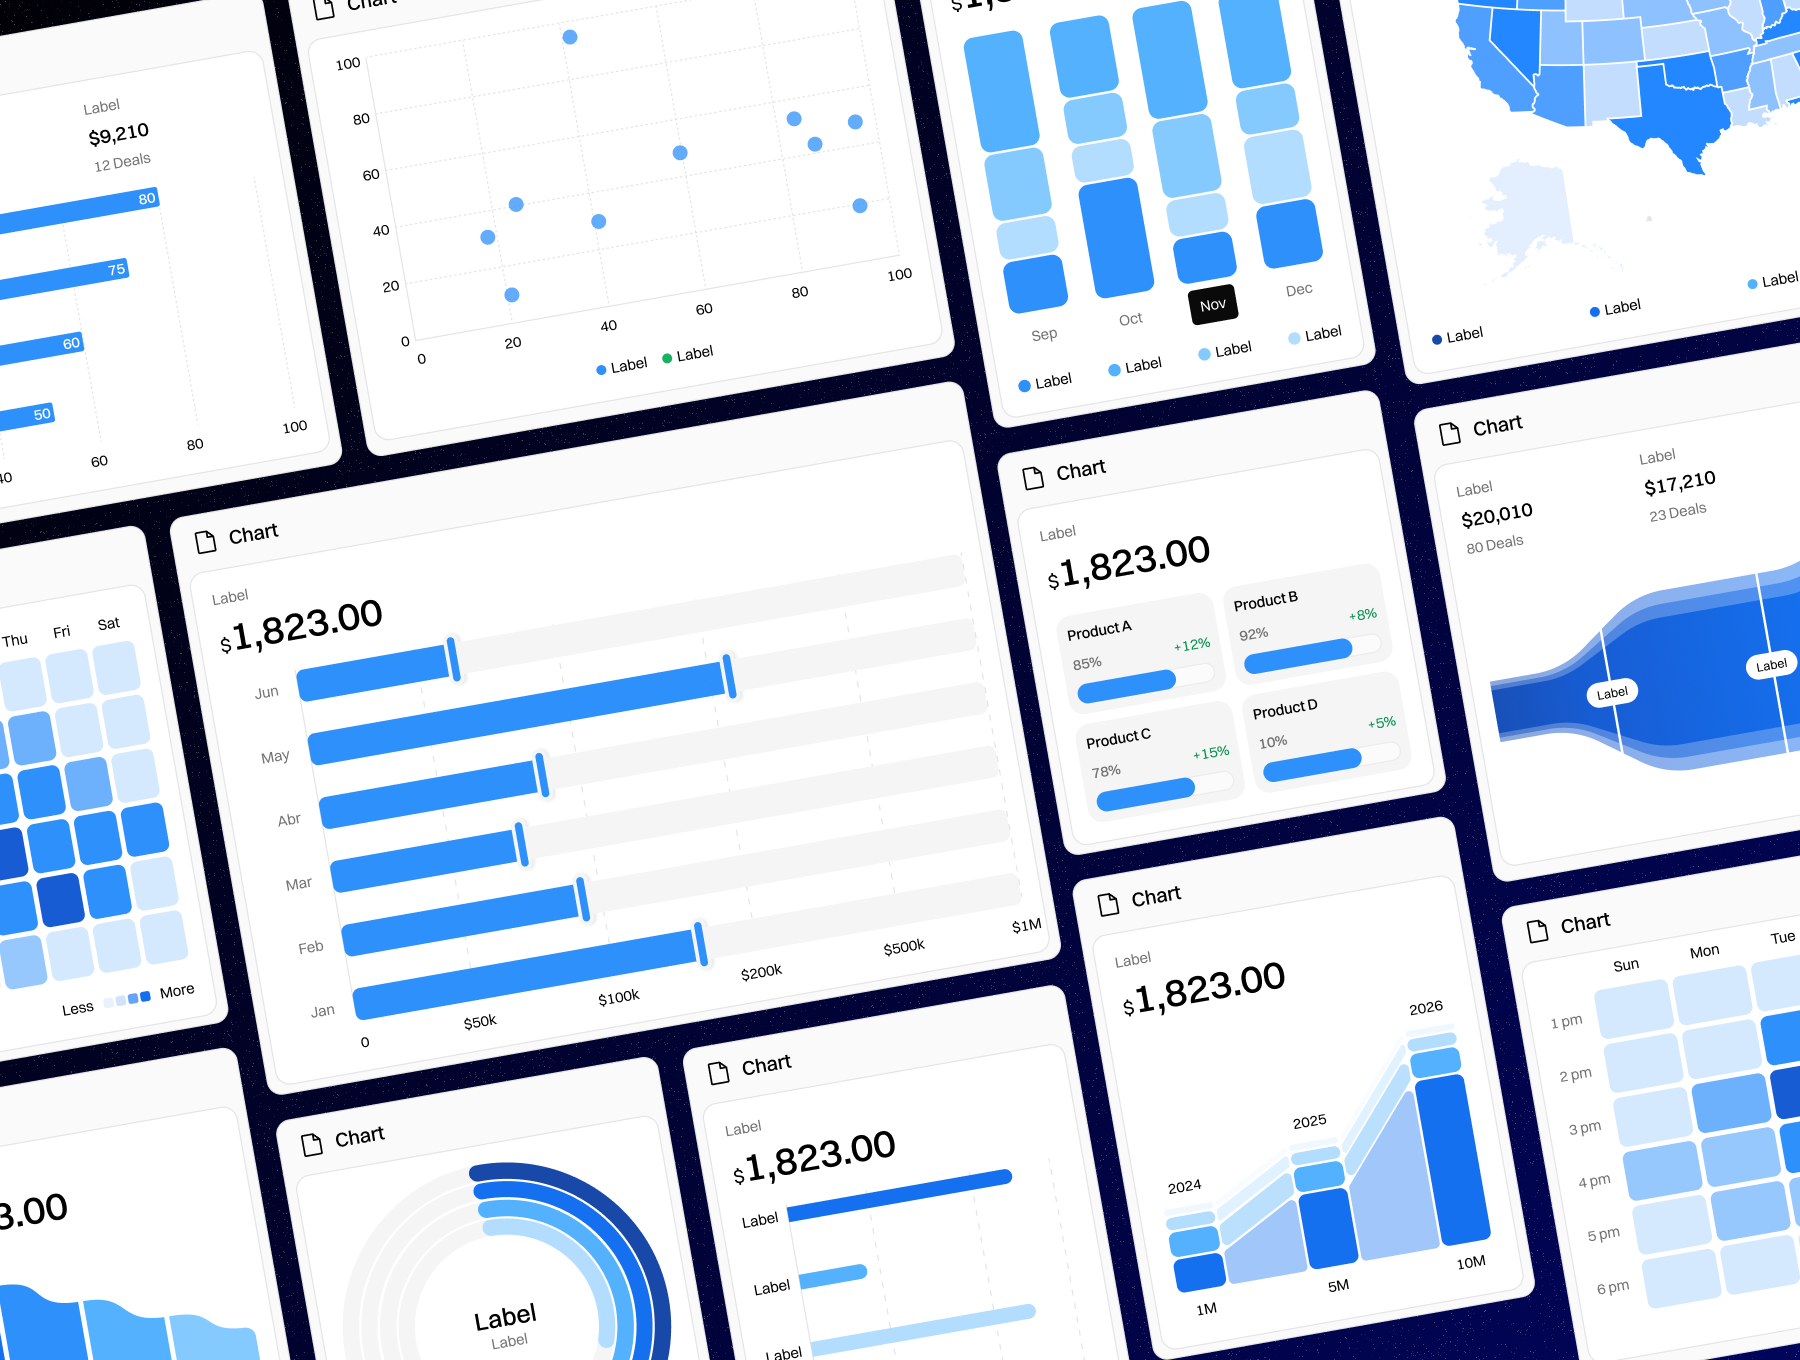
The kit includes 50 unique chart designs, each available in both light and dark modes, resulting in 100 total chart components ready for real product use.
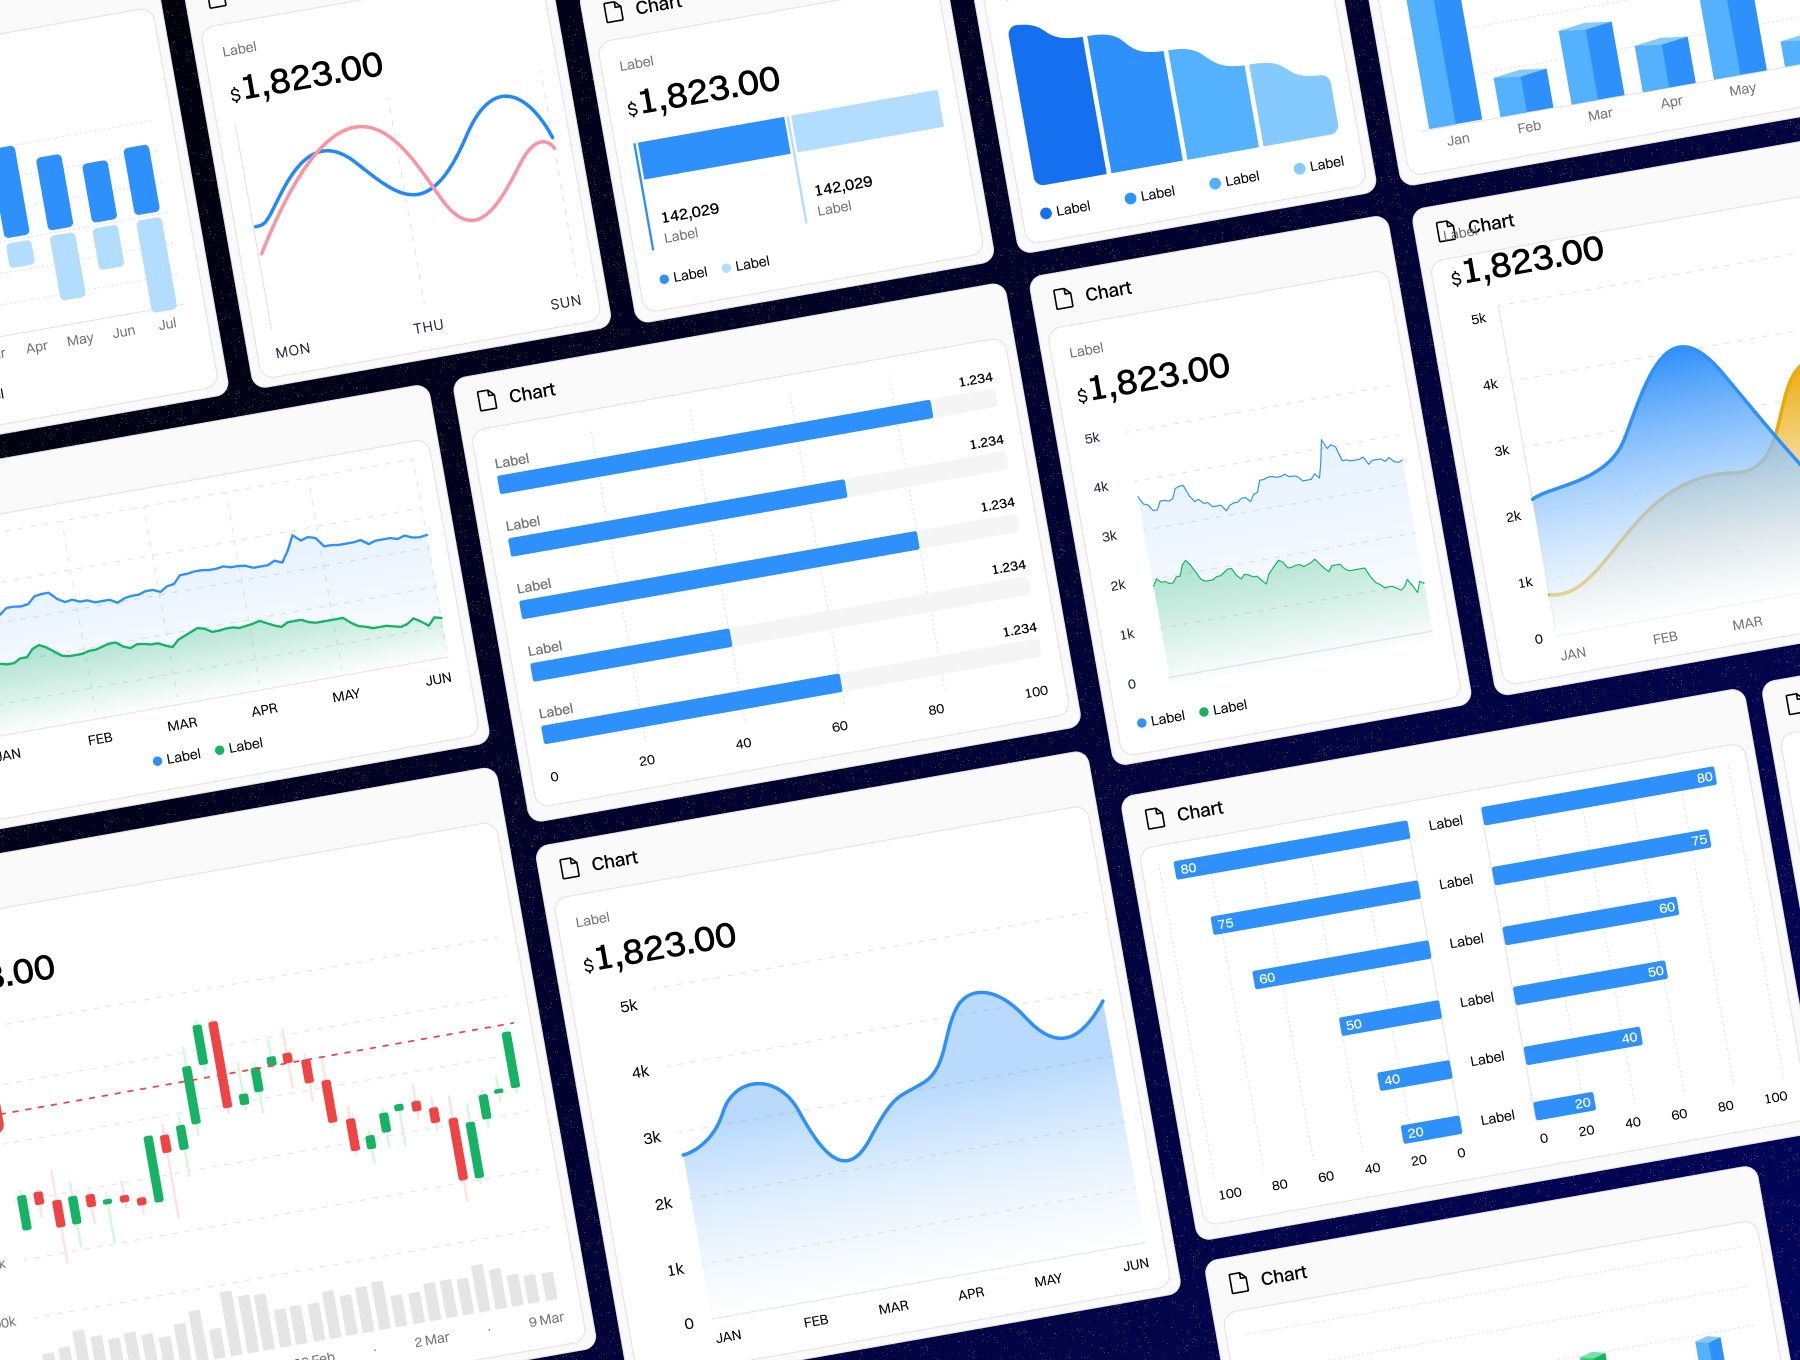
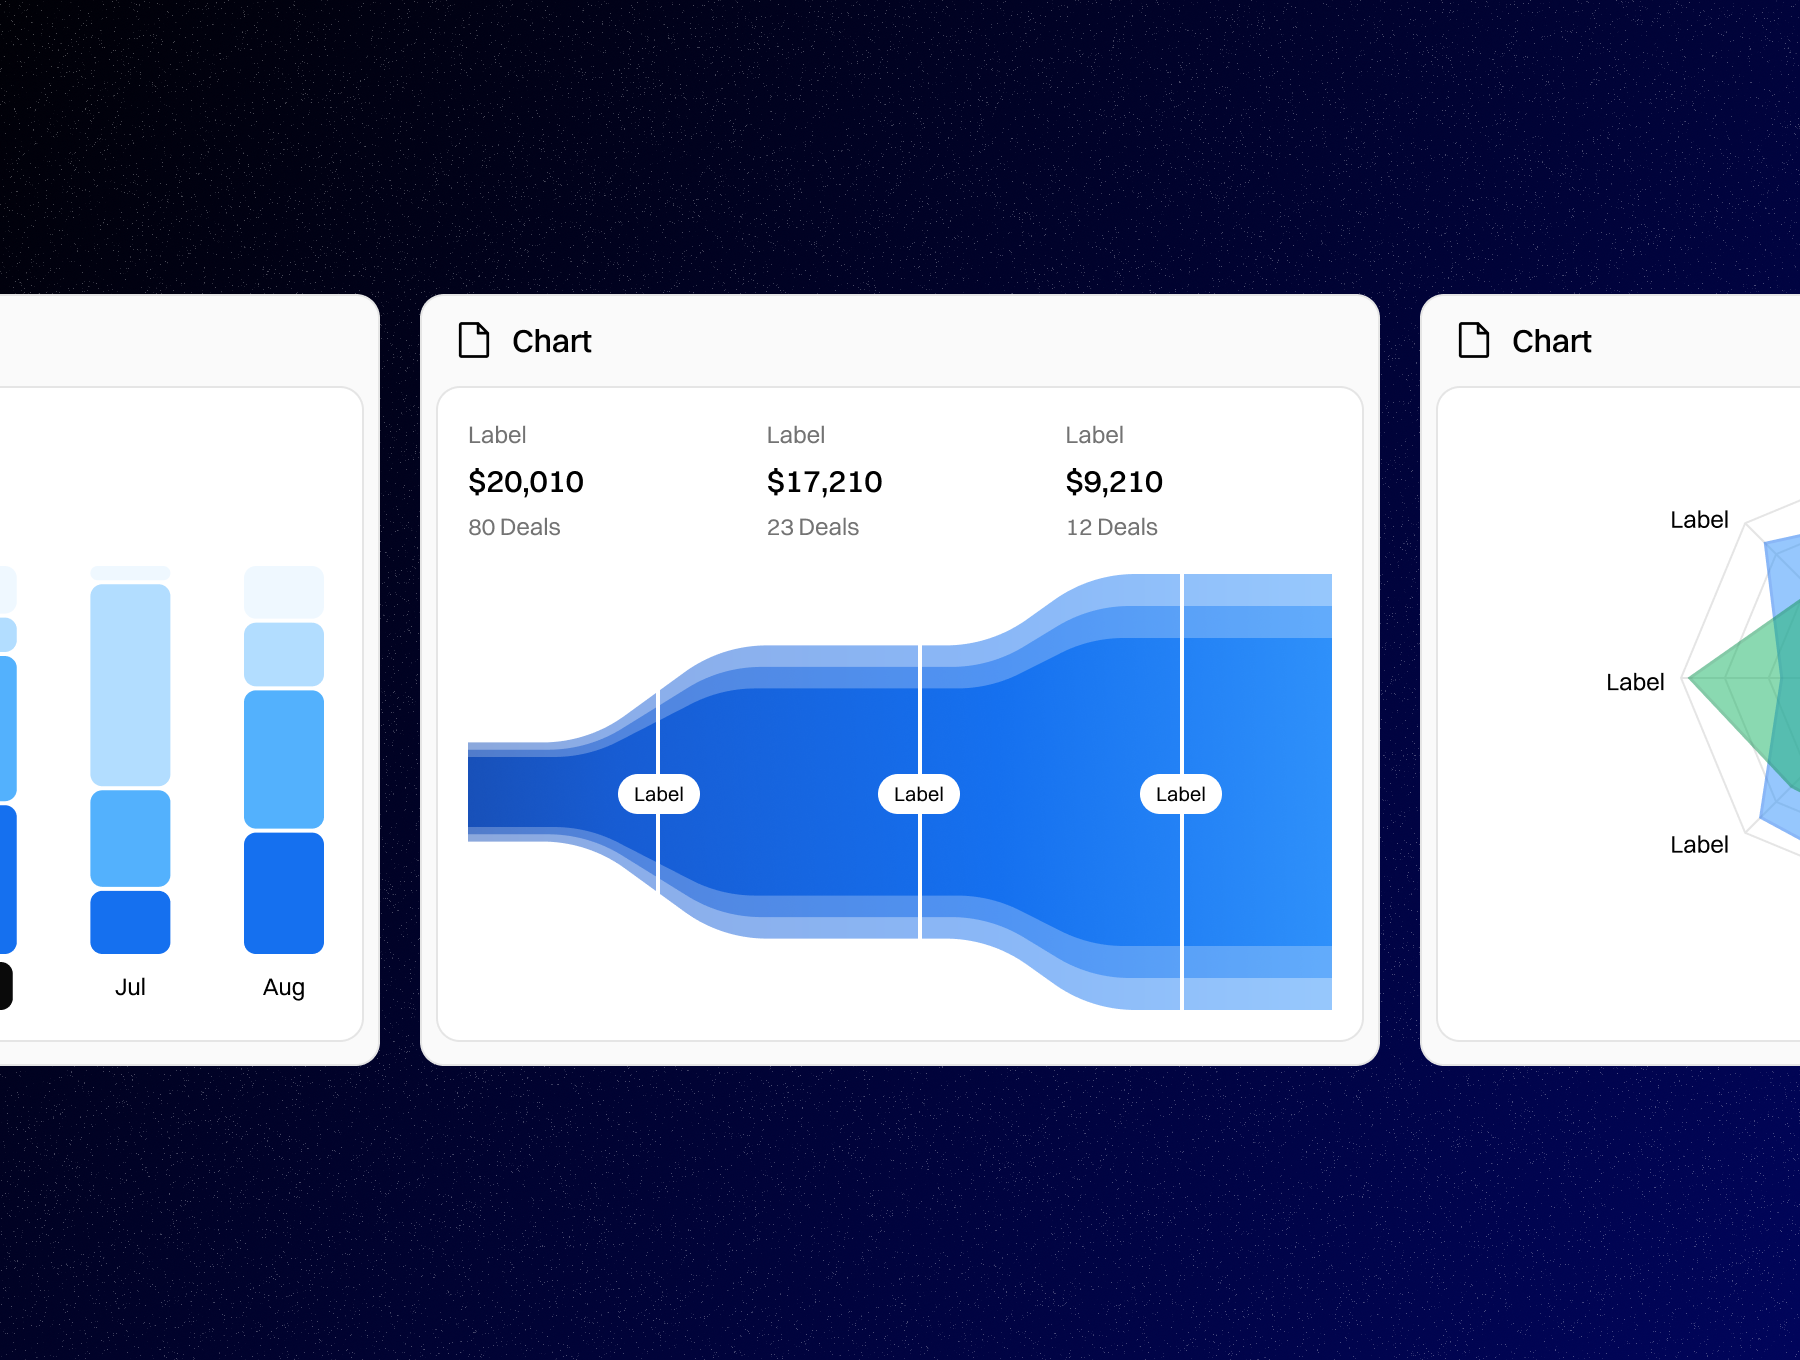
Designed with a clean and minimal aesthetic, this pack focuses on clarity, readability, and modern visual presentation of complex data.
The kit includes a wide variety of chart types such as:
- Line charts
- Bar charts
- Area charts
- Pie charts
- Donut charts
- Radar charts
- Progress charts
- Financial charts
- Comparison graphs
- Performance analytics visuals
Each chart is carefully crafted with consistent spacing, typography, and scalable layouts, making it easy to integrate into any dashboard or product interface.
Built with reusable components and structured styles, the system allows designers to quickly customize colors, data, and layouts while maintaining a polished and professional look.
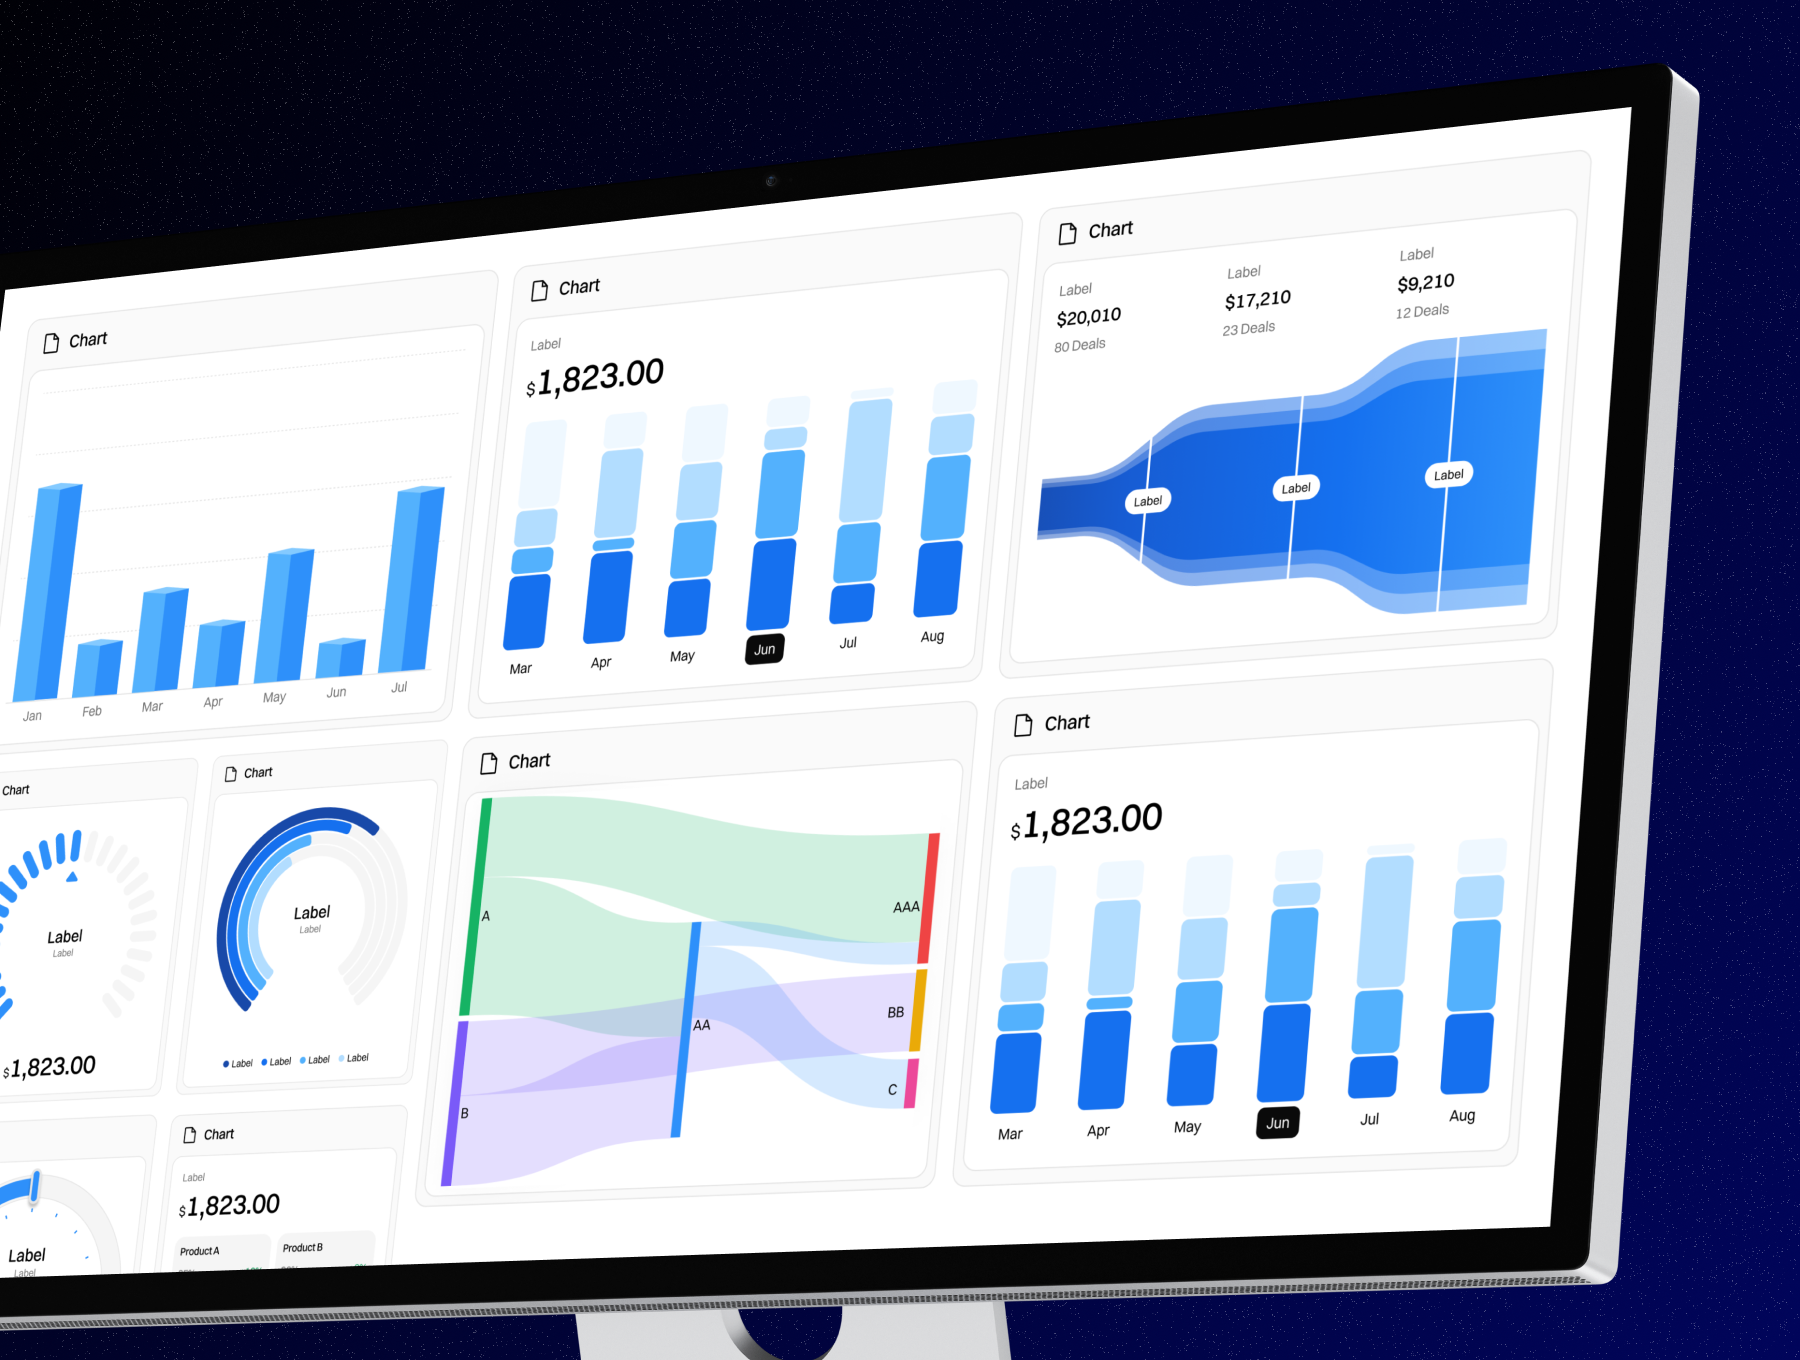
This UI kit is ideal for:
- SaaS dashboards
- Analytics platforms
- Finance apps
- Admin panels
- Data-driven products
Highlights
- 50 Unique Chart Designs
- 100 Total Variants (Light & Dark Mode)
- Clean, Minimal & Premium Aesthetic
- Built for Dashboards & Analytics Apps
- Clear & Modern Data Visualization
- Fully Scalable & Reusable Components
What's Your Reaction?
 Like
0
Like
0
 Dislike
0
Dislike
0
 Love
0
Love
0
 Funny
0
Funny
0
 Angry
0
Angry
0
 Sad
0
Sad
0
 Wow
0
Wow
0
![[VIP] Fintech Widgets Pack: Futuristic UI Dashboard System](https://i.pinimg.com/1200x/7e/20/2c/7e202cbcaa4ac65ff1dd3153714584bd.jpg)
![[VIP] Axion: monochrome banking App](data:image/png;base64,iVBORw0KGgoAAAANSUhEUgAAAcIAAAEYAQMAAAD1c2RPAAAAA1BMVEUAAACnej3aAAAAAXRSTlMAQObYZgAAACVJREFUaN7twQEBAAAAgqD+r26IwAAAAAAAAAAAAAAAAAAAACDoP3AAASZRMyIAAAAASUVORK5CYII=)


